Before making any decisions about the design and planning of a bikeshare system, cities should clearly identify their objectives for bikeshare. Bikeshare systems are often implemented as part of a general sustainable transport initiative to reduce pollution, improve mobility options, and/or achieve other strategic objectives.
For example:

<strong>San Francisco, Mexico City & Pittsburgh<br /> </strong>When it was launched, Ford GoBike (formerly Bay Area Bike Share) aimed to address the first-last-kilometer problem for transit passengers by installing bikeshare stations adjacent to Caltrain and BART stations.
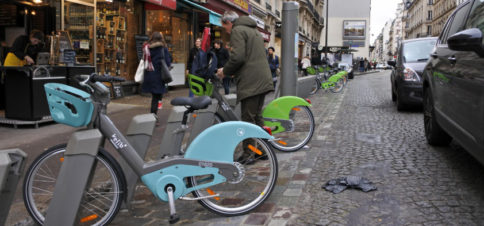
Paris
Vélib’ was originally adopted as a mechanism to reach a 25% reduction in greenhouse gas emissions by 2020, in line with the city’s Climate Energy Plan.
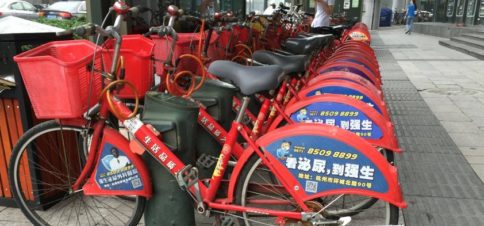
Hangzhou
Funded by the city, bikeshare was implemented as a means of developing tourism and generating employment for residents
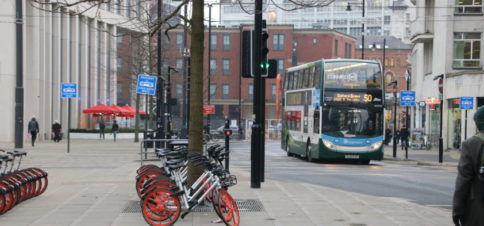
Manchester
Greater Manchester has a regional goal of increasing the percentage of total trips made by bike to 10%, and is providing bikeshare through a partnership with dockless operator, Mobike, to help expand access to cycling.
These locally defined objectives will inform subsequent decision making around system type, operations, and marketing. For more detail about what types of goals bikeshare can help achieve, see section 1.2: The Opportunity of Bikeshare.
3.1.1 ESTABLISH METRICS TO EVALUATE PERFORMANCE
Once cities establish qualitative goals for their bikeshare systems, they should
define metrics to track progress toward those goals. To meet the performance metrics
described below, a certain number of bikes will need to be in service. This can help cities make
initial estimates about fleet sizes in addition to evaluating performance after the system has
launched. Data from operators will be critical to performing these evaluations, and cities
should establish data sharing standards that operators agree to meet prior to starting service.
See section 6.5: Data Requirements and Management for more.
INDICATORS
If they do not already, cities should begin to collect data on several indicators that estimate
bikeshare’s broader effect on mobility and accessibility. These indicators are not associated
with a specific target. Instead, cities should track progress over time in an effort to better
inform policy choices, but not necessarily operations. The following are suggested indicators;
cities can, of course, track alternative indicators such as the percentage of short trips (less
than 5 km.) made by bike, but this would require additional data collection capabilities.
Mode Share
Percent of trips made by bike
Tracking mode share changes over time can help cities continue to make the case for
bikeshare, especially if the share of total trips made by bike increases and the share of total
trips made by private car decreases. Depending on availability, data on mode share can be
collected and calculated for all trips or commute trips only.
Accessibility by Low Income Users
Average percentage of low-income residents within 500 meters of a bike or station
Defining how accessible a bikeshare system is can be difficult, but access to real-time data
from bikeshare operators allows cities to measure how many low-income residents can
reasonably walk to a bike (for dockless systems) or station. This can be done by downloading
snapshots of the real-time service map at varying times each day. A 500 meter service area would
then be created around each bike and/or station, and then the percent of low-income (defined
by the city) residents within that service area would be calculated. Averaging these together
would yield the percent of low-income residents near bikeshare.

PERFORMANCE METRICS
The following performance metrics enable cities to measure the utility and stability of a
bikeshare system, and compare system performance across multiple cities. An efficient,
reliable and cost-effective system will optimize two critical performance metrics:
Average daily trips per bike
Target: 4-8 daily uses per bike
Turnover is critical to a successful bikeshare system, and this metric gets at how efficiently the
bikes are being used. Fewer than four daily uses per bike can result in financial unsustainability
for the operator (i.e., user fees not able to cover cost to operate each bike), while more than
eight daily uses can indicate limited bike availability, especially during peak hours. New York
City (6.4), Barcelona (6.4), Mexico City (5.4), and Guangzhou (5.0) showed solid daily usage
numbers in 2017.
If bikes are not readily available to as many potential users as possible, the system will not be
viewed as a reliable mode that can replace or compete with other options, such as private
cars. A high number of average daily trips per bike may indicate that there are too few bicycles
in circulation. More stations (and bikes) should be added to station-based systems with high
average daily uses per bike (see subsection 4.1.2: Station Sizing for more), while cities with
dockless bikeshare systems with high average daily uses per bike should consider raising the
fleet size cap, if one is in place, on the number of bikes per operator (see subsection 4.2.2 for
more on fleet size caps).
If a system has relatively few uses per bike, this might indicate inefficient usage of infrastructure
and low cost-benefit, likely because of a surplus of bikes. A system with many bikes being ridden
by a small group of users could result in the perception that bikeshare is not being used enough
to justify its expense to the city (in the case of publicly funded systems) or justify its use of
public space (especially for privately operated systems). If this is the case, station-based
systems may want to consolidate and/or decrease the size of certain stations. Similarly, cities
with multi-operator dockless bikeshare systems that show few daily uses per bike may want to
lower the cap on the number of bikes per operator, or establish a cap if one is not already in use.
Alternatively, to broaden the user base and increase awareness of the system, the city may want
to bolster education and marketing campaigns. Existing barriers to ridership may help inform
which of these two approaches—fleet size reduction and encouraging ridership—will be most
successful. For example, if the city lacks sufficient biking infrastructure, short-term solutions like
marketing will not address that issue, and so reducing the number of bikes or stations in the
short term may be the best way to increase usage. However, if other barriers to cycling (culture,
cost per ride, etc.) are more prevalent, outreach and education efforts may be able to boost
infrastructure usage in the short term.
Average daily trips per 1,000 residents (in service area)
Target: city-generated, improvement over time
This is a metric of market penetration, that is, how many people in the service area are using
the system. A high number of uses spread across residents in the service area is key to
increasing bicycle mode share, decreasing vehicle and transit network congestion, and
promoting safe, clean, healthy modes of transport. Trips per 1,000 residents should be
monitored as the system matures, with the goal of increasing market penetration over time (a
more prescriptive target for annual improvement in market penetration could be created from
baseline trip numbers). An increase in trips per 1,000 residents indicates more trips being
taken by bike, and can help to evaluate progress toward citywide mode shift goals.
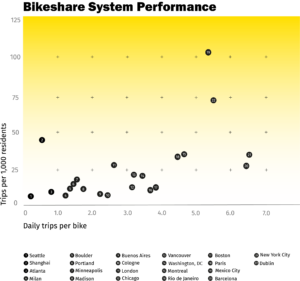
A well-planned and calibrated bikeshare system will ensure optimum performance for both
of these metrics. The following chart of Bikeshare System Performance shows infrastructure
usage and market penetration for 22 bikeshare systems. Comparatively, Mexico City has the
most trips per 1,000 residents (approximately 105) of the cities that fall within the target range
of four to eight daily trips per bike. Dublin also has relatively high market penetration at 75
trips per 1,000 residents and optimal daily trips per bike (5.6). Mexico City and Dublin’s high
market penetration may be the result of a large influx of commuters who do not reside in the
service area taking trips during the work day. New York, Paris, and Barcelona fall within the
target range for daily trips per bike, but could prioritize efforts to expand market penetration.
Conversely, Shanghai’s dockless bikeshare system, while yielding relatively high market
penetration, has less than one daily trip per bike. This is likely an indication of an oversupply
of bikes.