A feasibility study will estimate basic system metrics, evaluate potential investment and
revenue sources, and recommend (the agency or department conducting the feasibility study
may not be the implementing agency) a contracting or permitting model and an organizational
structure. Identifying local contextual elements and potential obstacles to implementation
such as weather, topography, cycling infrastructure, culture, and political and legal realities, is
critical as well. The goal of a feasibility study, though, is to inform planning decisions that will
yield the most successful bikeshare system possible. A successful bikeshare system should be:
- Safe, reliable, affordable and accessible to all potential users
- Flexible and adaptable to changes in technology, trends, and operating models
- Thoughtfully connected to public transit and other modes
- Able to leverage and generate expanded investments and land use dedicated to cycling
- A tool to help meet broader sustainability goals set by the city.
Dockless bikeshare systems operated by private companies change the context around a
feasibility study—namely, because they do not have stations to site—however, it is still
strongly recommended that cities interested in pursuing a privately-operated dockless system
first undertake a feasibility analysis. Items for analysis, in addition to those for station-based
systems, should include target fleet size and/or number of operators, location of geofenced
“hubs” and/or other dockless bike parking strategies, integration among operators and with
the rest of the transportation system, and expected use patterns. Cities interested in
transitioning from an existing station-based system to a dockless system should also evaluate
these topics, even if a feasibility study was completed prior to the system’s original launch.
Furthermore, for any type of system, cities will need to understand whether they are an
attractive market for private investments. Many cities are conducting requests for information
(RFIs) or requests for expressions of interest (RFEIs) to evaluate whether private companies are
interested and willing to invest, and what those investments might look like. This provides a
more concrete understanding about what the private sector can actually provide, and enables
cities to weigh that option against a publicly operated system.
BASIC SYSTEM METRICS
A range of local data must be collected and analyzed to complete a feasibility study.
The following data points are critical to establishing the basic framework for the feasibility
study—defining the physical size of the area and the potential number of users:
Service Area
The contiguous area in which a bikeshare system operates
For station-based systems (and dockless systems with strict geofenced parking areas), the
service area is typically made up of a 500 meter radius around each station. For dockless
systems, the service area is typically the jurisdictional boundaries of the city, but could be
defined however the government sees fit. Over time, however, the true service area of a
dockless system may prove to be smaller than the whole city, and could be further defined
based on where bikes are available most often.


Population in Service Area
The number of residents within the service area
This figure can be estimated by summing the population of smaller geographic areas (i.e.,
census tracts in the US, dissemination areas in Canada, or 100 square meter grids for countries in South
America and Asia) within the bikeshare service area. For geographic areas that are only partially
within the service area, the percentage of the geographic area that falls within the buffer is
multiplied by that area’s population, and added to the total sum.
At its most basic level, a bikeshare system is comprised of a certain number of bikes (and, in
many cases, stations and docks) that will serve a given market. These basic data points are
explained below:
Number of bikes
The number of bikes in active circulation
This number includes bikes either in a dock, locked, or in use. This is not the total number of
bikes owned by a system or operator (which may include bikes that are being repaired or are part
of the contingency fleet), as this is less relevant to measuring the performance of the system.
Number of stations
The number of locations where bikes can be checked in or out
In a station-based system, stations can be permanent or temporary (moveable) and stations may
have multiple docks. In a dockless or hybrid system, virtual (using geofencing technology) and/or
physical (painted or otherwise delineated, and may include bike racks) stations may be
implemented to address indiscriminate parking issues.
Number of docks
The number of spaces in which a bike can be checked in or out
Docks are only found in station-based systems. The total number of docks should exceed the
number of bikes at a ratio of approximately two to one to ensure docks are available for
returning bikes during peak demand times.
USER TYPES
For planning purposes, two basic types of users are defined. This distinction is used to better
understand ridership characteristics and define fees. These are:
Casual
Users who purchase daily or weekly bikeshare passes
Casual users can typically purchase a daily, multi-day, or weekly pass on the day of use—often
at a station kiosk—and access the system immediately after using a code. Most tourists fall
into this category.
Per Trip
Casual users who purchase a single trip pass each time they ride
A subgroup of casual users, per trip riders pay for each individual bikeshare trip they take.
Dockless bikeshare riders are generally per trip users unless they have purchased a multi-ride
pack offered by some private operators. Several station-based systems now offer a per trip
fare option.
Long-term
Users who subscribe for a month or longer, including annual members
The registration process for annual members typically takes a day or more and often comes
with a physical registration key, such as a fob or membership card, that provides more
streamlined access to the system. Several private dockless operators also offer long-term
monthly and annual memberships.[26]
3.2.1 SOLICIT COMMUNITY INPUT AND IDEAS
At this stage, the city should begin to educate the public on the basics and opportunities of
bikeshare, and seek input from community organizations, cycling advocacy groups, and
residents about their views on how bikeshare should work in their city. Public meetings to
share information about the feasibility study process, as well as in-person and online forums
to provide comments and insights will help to establish transparency and cultivate a sense of
ownership of the project among residents. This level of engagement should continue past the
feasibility study stage, and into system planning and implementation.
3.2.2 DETERMINE SERVICE AREA
When beginning to plan a system, identifying a service area (the physical area within which
bikes can be rented and returned) and saturating it with the appropriate number of stations
and bikes is critical to cultivating high ridership. The service area should be grounded in
dense, mixed-use areas with high trip-generation capacity, serving as both the origin and
destination points of many trips. These areas—generally city centers—are likely to see the
most demand for bikeshare. However, the service area should also extend to lower-density
areas where connectivity to the transportation system may be lacking.
For station-based systems, the service area must be large enough to contain a significant set
of users’ origin and destination points. If it is too small to provide meaningful connections
between places, the system will have a lower chance of success because its convenience will
be compromised. When defining the service area, the city will have to balance demand with
costs. Surveying and statistical data analysis will help to identify the appropriate service area,
and should be completed by a qualified planning organization if the city does not have inhouse
expertise.The service area must be determined in tandem with the system’s size to
ensure the level of convenience, reliability, and ubiquity necessary for high ridership.
For dockless and hybrid systems, the service area is typically the jurisdictional boundary of
the city, and has less of an impact on overall system usability than is the case for stationbased
systems. Multi-jurisdictional dockless systems could reduce administration costs to
implement and oversee a permit process, and provide a larger service area for users.
Regardless, the city and bikeshare operators should clearly communicate to users locations
that fall outside the system’s limits, but are inside the city boundary (e.g., dockless bikes are
not permitted to be parked on the National Mall and other federally owned land in
Washington, DC). Establishing the appropriate system size is paramount for dockless
bikeshare, as increased ridership will come from bikes being available where and when users
demand them. See subsection 4.2.2: Fleet Size Caps for more.
3.2.3 DETERMINE SYSTEM SIZE
The size of a bikeshare system is determined by the number of bikes (and number
of stations). From a user perspective, density of stations and availability of docks (for station based
systems), and availability of bikes (for all system types) will be the main considerations.
For station-based systems, appropriate station density within the service area ensures that no
matter where a user is, there will be a station within a convenient walking distance of both the
origin and destination of their trip. A large area of dense stations creates a network that users
can learn to count on for all their trips in the city. The farther apart the stations, the less convenient the system is for the user. Difficulty finding a station or available docking space results in frustrated users.
A more nuanced look at station spacing and location is included in section 4.1: Planning Station-Based Systems.
Whether a system utilizes stations or not, if it has too few bikes, it will have little to no chance
of success. To establish reliability at a level that will generate subsequent rides, users must be
able to find a functioning, ready-to-ride bike when they need it. The following parameters will
help guide planning to ensure that the city’s bikeshare network is connected, convenient and
reliable. These are meant to be guidelines, or averages, for planning.
ALL SYSTEMS
Bikes per 1,000 residents
Target: 10-30 bikes per 1,000 residents
This parameter scales the number of bicycles to the number of potential users in the service
area to ensure that there are enough bicycles to meet demand. Based on ITDP’s analysis of
bikeshare system metrics, large, dense cities or areas with high numbers of commuters and/or
tourists will likely require 10 to 30 bikes per 1,000 residents to meet demand. Cities that have a
large influx of commuters during the day will need a higher ratio of bikes-to-residents to serve
that augmented population.
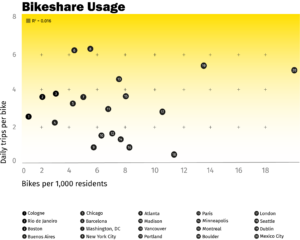
This ratio should be large enough to meet demand, but not so large as to have fewer than four
daily uses per bike. Dockless bikeshare in the largest Chinese cities has generated very high
bikes per resident ratios (62 bikes per 1,000 residents in Shanghai and 57 per 1,000 residents in
Guangzhou), but more moderate ratios in relatively smaller cities like Tianjin (23 bikes per
1,000 residents, which is just slightly higher than Mexico City’s 19 per 1,000 residents). This
metric serves as a planning guideline to estimate the total number of bikes needed for a
system, which can then be used for cost estimate purposes. For dockless systems, this metric
can help cities establish a cap on the total number of bikes in operation.
Bike Density
Bikes per square kilometer of service area
Compared to bikes per resident, bike density provides a more accurate picture of how bikes
are spread throughout the service area, especially as it relates to population and job density.
This metric may be particularly useful in evaluating performance over time—especially for
dockless systems. Cities may use this metric to improve reliability by requiring operators to
maintain a minimum bike density in certain zones.
Bike Density and Performance
Increasing the number of bikes per resident generates more trips and higher market penetration. The relationship between bikes per resident and bike use is less clear; Mexico City and Dublin are the only two cities in the dataset that meet the 10-30 bikes per 1,000 residents and 4-8 daily trips per bike targets.


STATION-BASED SYSTEMS

There are only 8 Hubway stations per square kilometer in Boston. Source: ITDP data

There are 21 Ecobici stations in this square kilometer of Mexico City.
Station Density
Target: 10-16 stations per square kilometer
To create a reliable network, cities should pursue a more or less uniform station density
throughout the service area to ensure that users can easily bike and park anywhere in that area.
The station density parameter—average number of stations within a given area—ideally scales the
spacing of stations so they are within a reasonable walking distance to each other. As shown in the
Station Density and Performance graph, below, increasing station density generates increased
market penetration (defined as trips per resident). Additionally, station density should correspond
to population density; more stations closer together will help meet demand in more densely
populated areas, while less dense areas may see demand met with fewer stations. Maintaining a
consistent level of convenience in lower density areas by oversupplying stations will generate
higher costs; the city should evaluate where those costs will yield the most value. Paris used one
station every 300 meters as a guideline for the first phase of its bikeshare system, as did London
and New York. Phase one in Mexico City used one station every 250 meters. While this serves as a
planning guideline for the detailed design, it also helps to generate the total number of stations
needed for the system, which can be used for cost estimate purposes.
Station Density and Performance
A higher station density correlates with higher market penetration, and has an even stronger relationship with increased use of bikeshare bikes.


Docks per Bike

Having more docking spaces than bikes is critical to ensuring that parking is available at multiple locations. A low dock per bike ratio will likely result in the need to rebalance the system more frequently to avoid station saturation—especially at peak destinations. Once the number of bikes for the system has been determined, the number of docks needed can be
calculated. As an industry standard, most medium and large systems have 2-2.5 docking stations for each bike in service. Vancouver, Portland, and Dublin have 2.1 docking stations for each bike in service, while Rio de Janeiro has 3, New York City has 2.4, and Washington, DC has 2.2. The docks per bike ratio is important to keep in mind for initial system planning, as well as when expanding the system. However, the docks per bike ratio is not necessarily used for
analyzing system performance.
3.2.4 CHOOSE A BIKESHARE SYSTEM TYPE
Once the feasibility analysis is underway and the goals for the bikeshare system have been
agreed upon, the city must decide on the type of bikeshare system that will best achieve those
goals. System types include:

Station-based
Systems that require bikes to be picked up from and returned to designated docking points or smart docks.

Dockless
Systems that do not require any standard docking points and do not have physical stations or hubs in which bikes must be locked.

Hybrid
Systems that include docking points at both physical stations and geofenced hubs.
The following chart identifies strengths and weaknesses of the three system types from both the city
and user perspectives. Trade-offs between the two groups become apparent; station-based systems
pose high capital and operations costs to the city, but provide a reliable, comfortable service for users. Dockless systems are more scalable due to lower capital costs, but raise public space, equity and other operations concerns if not well-regulated by the city. This chart is not meant to be exhaustive of every strength and weakness of each system type; rather, it provides a means of comparison as cities consider which system type will best position them to achieve their stated goals.
System Types Strengths & Weaknesses
